Hotspots
Hotspots are locations where the probability is high to find thermals.
The data that are used by SkyLogger have been and are being calculated by Michael von Kähnel. For the calculation flights from various servers and databases worldwide are being analyzed. The data is not only analyzed for potential locations but also by time. This results in different datasets for the months January, April, July and October. Based on this time distribution the yearly trend of the probability of finding thermals at various locations can be shown.
 The data is furthmore divided by the time after sunrise. This results in datasets for each mentioned month at 4 hrs, 7 hrs and
10 hrs after sunrise at the calculated locations.
The data is furthmore divided by the time after sunrise. This results in datasets for each mentioned month at 4 hrs, 7 hrs and
10 hrs after sunrise at the calculated locations.
All hotspots have been calculated for a radius of 250m.
Before being able to visualize the hotspots their data has to be loaded from a server. This can be done in the preferences.
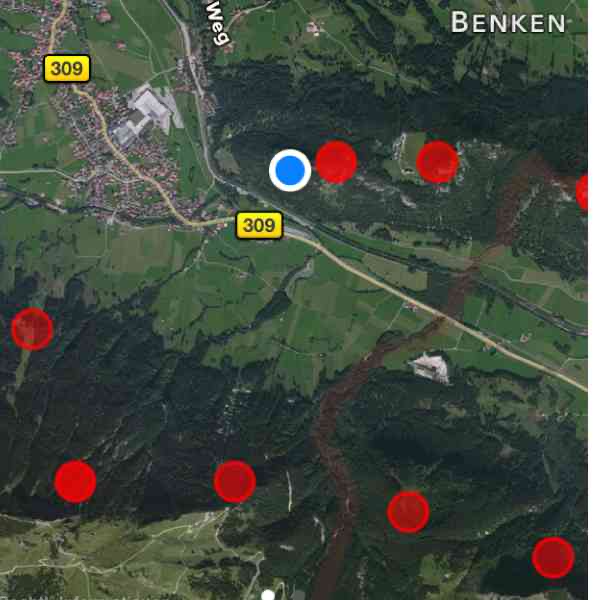
The calculated hotspots can be displayed on the maps. They are visualized by filled red circles. Locations, where the probability of finding thermals is high, are drawn nearly opaque. Locations, where only once a while thermals can be found, are drawn with a high transparency. Therefore, at these locations the original map shines through.
On the shown map on the right the upper hotspots, indicate locations with a high probability for finding thermals. Hotspot on the lower part of the map are rather transparent and indicate locations with a modest probability to find thermals.
Hotspots visualize distinct locations of high probabilty of finding thermals, the overview of thermals shows larger areas where the probability is high to find thermals.
In the preferences for the map the display of hotspots can be activated and time filters can be set. To unnecessarily load to many data points the filters should be set in a way that only really needed data is shown.
Remark: The hotspots only visualize the probability to find thermals at various locations but they do not indicate the strength of these thermals!