Climb rate traces
During flight logging traces of the climb rate can be visualized on the map at the logged locations. Climbing is visualized in green, sinking in red. The size of the shown points indicates the strength of the climb or sink rate. Older data points fade out by time. The colors, the size of the points as well as the time for the fading operation can be individually set in the preferences.
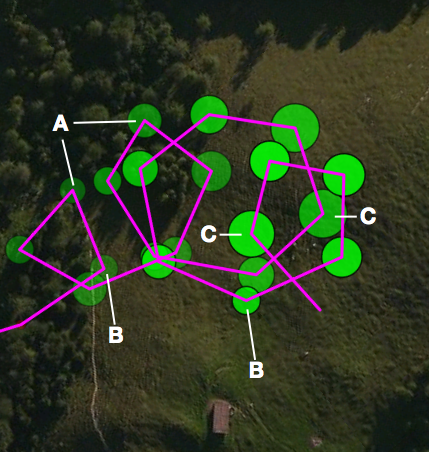 In the first shown example points marked "A" are relatively old. The points "B" visualize a moderate
climb rate while points "C" indicate a good climb rate.
In the first shown example points marked "A" are relatively old. The points "B" visualize a moderate
climb rate while points "C" indicate a good climb rate.
It can also be seen that the pilot flew from left to right while circling moving towards better climb rates.
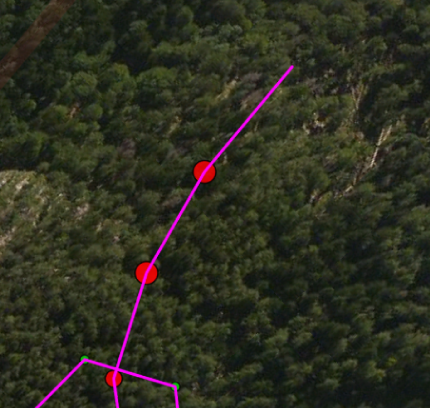 In the second example the pilot had modest climbing rates at the lower edge of the picture. Then, he left the location towards the
"upper" side and came into modest air mass sinking.
In the second example the pilot had modest climbing rates at the lower edge of the picture. Then, he left the location towards the
"upper" side and came into modest air mass sinking.